This notebook is available at https://github.com/SterlingYM/PIPS/tree/master/docs/tutorial.ipynb
Tutorial
PIPS contains various tools for time-series analysis in astronomy, with primary focus on detecting the period of variability. PIPS is objectively programmed, so that the analysis can be performed in a straightforward way.
In this introductory tutorial, you will learn the quickest methods to do the following operations:
Installing PIPS
Initializing photometric data object —
PIPS.photdataGenerating periodogram —
photdata.periodogram(): basic & advancedDetecting main period —
photdata.get_period(): basic & advancedQuick visualization —
photdata.get_bestfit_curve(): basicMulti-period analysis —
photdata.amplitude_spectrum(): basic
Importing PIPS
PIPS is currently distributed on PyPI and GitHub under the name of astroPIPS. However, the package name itself is still under PIPS, and hence the import statements becomes as shown below:
[1]:
import PIPS
from PIPS.resources.sample_RRL import samples
import matplotlib.pyplot as plt
import numpy as np
import warnings
warnings.filterwarnings(action='ignore')
[2]:
PIPS.about()
--------------------------
-    Welcome to PIPS!    -
--------------------------
Version: 0.3.0-beta.1
Authors: Y. Murakami, A. Savel, J. Sunseri, A. Hoffman, Ivan Altunin, Nachiket Girish
--------------------------
Download the latest version from: https://pypi.org/project/astroPIPS
Report issues to: https://github.com/SterlingYM/astroPIPS
Read the documentations at: https://PIPS.readthedocs.io
--------------------------
Before you start – sneak peek at PIPS in 5 lines
Photometry data to phase-folded light curve – This is what you can do with PIPS in 5 lines of code!
[13]:
# data prep & initialization
data = samples[0]
star = PIPS.photdata(data)

# generate periodogram
star.periodogram(p_max=1.0).plot()

# automatic period detection
star.get_period(N0=20)

# plot phase-folded data, best-fit curve, and time of maxima
star.plot_lc(plot_bestfit=True,plot_epoch=True)
PIPS is designed so that it can be as simple as this for basic analyses, but at the same time PIPS provides a powerful platform for more high-level analysis for professional astronomers. In the tutorial below, we go over the basic steps to perform some of the most frequent operations and analyses.
Data preparation
PIPS takes in an array of 3xN data (samples are available on github) – time, magnitude (flux), and error on magnitude contained in a single python list or numpy array. For convenience, photometry data file from LOSSPhotPipeline can be directly imported using a helper function data_readin_LPP.
[14]:
data = samples[0]
x,y,yerr = data
print('data shape:\t',np.array(data).shape)
print('x shape:\t',x.shape)
print('y shape:\t',y.shape)
print('y-error shape:\t',yerr.shape)
data shape:      (3, 103)
x shape:         (103,)
y shape:         (103,)
y-error shape:   (103,)
Create photdata object
Most of the functions in astroPIPS is implemented as methods in photdata object. Once the photdata object is initialized, various operations, such as period detection and data manipulation, can be done directly to the object.
[15]:
star = PIPS.photdata(data)
This object initially contains raw data, and as the user performs analyses using various functions, more information, such as cleaned data, period, or amplitude, will be stored.
The list of variables in the object can be printed with the following code:
[16]:
print('Initially defined variables: ')
# for att in dir(star): print('- ',att) )
[print('- '+att) for att in dir(star) if not callable(getattr(star, att)) and not att.startswith('__')];

print('\nAvailable functions: ')
[print('- '+att+'()') for att in dir(star) if callable(getattr(star, att)) and not att.startswith('__')];
Initially defined variables:
- amplitude
- amplitude_err
- band
- data
- epoch
- epoch_offset
- label
- meanmag
- multiprocessing
- period
- period_err
- shape
- x
- y
- yerr

Available functions:
- _get_period()
- _get_period_likelihood()
- amplitude_spectrum()
- check_model()
- classify()
- copy()
- cut()
- get_SDE()
- get_SR()
- get_bestfit_amplitude()
- get_bestfit_curve()
- get_chi2()
- get_epoch_offset()
- get_meanmag()
- get_period()
- get_period_multi()
- open_widget()
- periodogram()
- plot_lc()
- prepare_data()
- reset_cuts()
- summary()
It is always a good idea to keep track of the name and photometric band of the object. For instance, the name of data file can be used as a label:
[17]:
star.label = '000.dat'
star.band  = 'V'
Generating periodogram
periodogram() function provides the most basic yet most valuable information on variability analysis. This is an extended application of Fourier transform in the period space (1/frequency). This function requires arguments p_min and p_max, which limits the range of periodogram (hence period search). The unit has to be the same (often days in astronomy) as the x-axis in the input data.
basic method
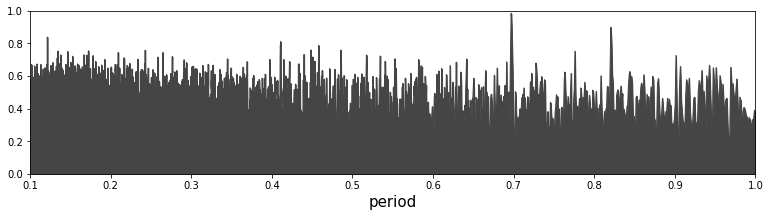
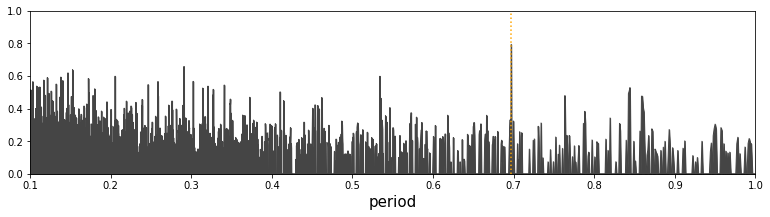
Most simply, users can call star.periodogram(p_min,p_max).plot() to generate periodogram.
A few things to note: - This function shouldn’t take more than a few seconds to run. If no result is returned, it may be because your platform does not support multiprocessing operation, in which case we recommend adding another argument multiprocessing=False to periodogram() function call. - If no p_min or p_max is given, periodogram is generated between 0.1 and 4 (days if your data is in days).
[22]:
# periodogram: searching the period between 0.1-day and 1-day
star.periodogram(p_min=0.1,p_max=1.0).plot(show_peak=True)
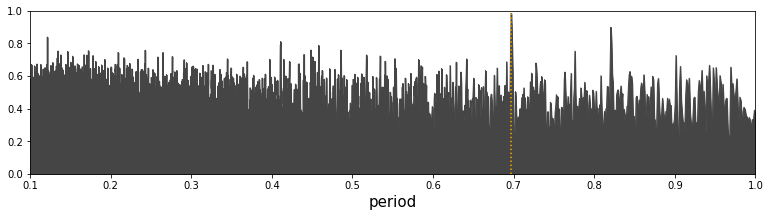
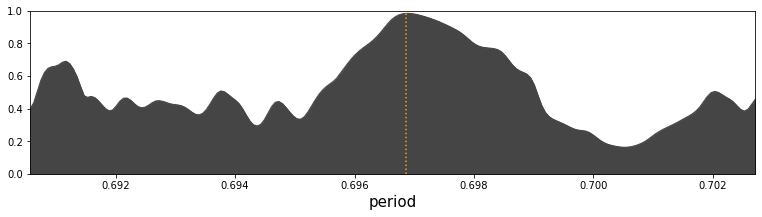
Zooming in to the peak and re-sampling can also be done in a single line:
[23]:
star.periodogram(p_min=0.1,p_max=1.0).zoom().plot(show_peak=True)
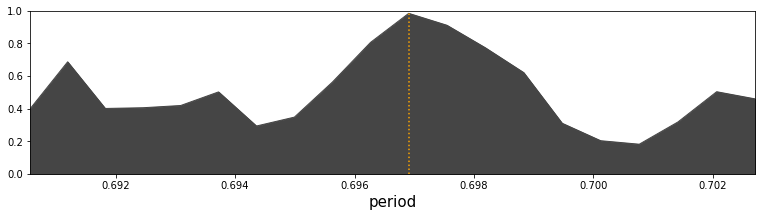
[24]:
star.periodogram(p_min=0.1,p_max=1.0).zoom().refine().plot(show_peak=True)
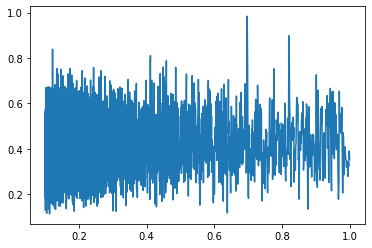
Obtain periodogram as arrays
The periodogram() function generates an iterable object. Users can easily obtain the values of periodograms and analyze or plot them manually.
[29]:
periods, power = star.periodogram(p_min=0.1,p_max=1.0)
plt.plot(periods,power);
print(periods.shape,power.shape)
(6830,) (6830,)
More advanced method
By default, periodogram function uses 5-term Fourier model, for which a linear algebra-based faster method is available. For instance, the basic method shown above is equivalent to calling periodogram(p_min=0.1, p_max=1.0, method='fast', model='Fourier', Nterms=5).
Users can change the template model based on the expected shape of light curve. Another pre-implemented function is Gaussian Mixture Model (GMM), which can be specified by changing the model argument: periodogram(p_min=0.1, p_max=1.0, method='custom', model='Gaussian', Nterms=5). Since GMM is integrated with Super-Gaussian function in PIPS, users gan give another argument p, which changes the power parameter in Super-Gaussian.
Note the change in method argument as well: while we implemented Gaussian fitting in log-linear form (method='fast'), the resulting fit is often erraneous and thus linear regression (method='custom') is preferred for Gaussian model. More discussion on this topic can be found in our paper.
We internally use scipy.optimize.curve_fit() for linear regression. Since this is significantly slower than linear-algebra method, we recommend users to try finding the optimal maximum iteration by changing maxfev argument as shown below.
[33]:
# periodogram test w/ Gaussian
star.periodogram(p_min=0.1,p_max=1,                ## period search range
                 method='custom',model='Gaussian', ## model selection
                 Nterms=1, p=1,                    ## arguments for the model
                 maxfev=100                        ## max iteration in linear regression
                ).plot(show_peak=True)
Using your own custom function
Users can use any custom function as a model to be used in periodogram. The model must be accompanied by initial-guess generator (p0_func), both of which needs to take speficic format in the argument. See the function docstrings below.
[26]:
### define custom functions
from numba import njit
@njit

def polynomial(x,period,params,arg1,arg2=2):
    '''
    An example custom function (model).
    Any custom function must take the arguments (x,period,params),
    and users can add as many fixed (not fitted) arguments as needed.

    In this function, users can define the exponent in the polynomial
    by providing arg1 and arg2.
    '''
    mod = np.remainder(x,period)
    return params[0] + params[1]*(mod-params[3])**arg1 + params[2]*(mod-params[4])**arg2

def poly_p0(x,y,yerr,period,**kwargs):
    '''
    An example of initial-guess generator (p0_func).
    Any p0_func must take the argments (x,y,yerr,period,**kwargs).
    The output array or list must be in the same shape as "params" in the model functon.
    '''
    return [np.mean(y),1,1,period/2,period/2]
[32]:
### generate periodogram with the custom function
star.periodogram(
                p_min=0.1, p_max=1,   ## period search between 0.1 to 1 day
                method  ='custom',    ## for any custom function this argument needs to be given
                model   = polynomial, ## now you can pass the function itself!
                p0_func = poly_p0,    ## initial-guess generator function must be given as well
                arg1    = 1,          ## users MUST specify arguments if not default is speficied
                arg2    = 4,          ## since arg2=2 is speficified by default, this is optional
                maxfev  = 100         ## start with small maxfev and increase later
                ).plot(show_peak=True)
Period detection
Period detection function utilizes periodogram() and automatically detects the peak. The periodogram is then refined near the detected peak for accurate period detection. This is followed by linear regression to estimate the uncertainty of detected period.
A few things to note: - photdata.get_period() function by default uses 5-term Fourier model. - Users can simply run the function without any arguments to search period between 0.1-4.0 (days). - Detected period and period error is stored in photdata.period and photdata.period_err. - This function also returns period and period error.
Basic method
[34]:
star.get_period(); # no argument -> 5-term Fourier, searches period between 0.1-4 day
print(star.period, star.period_err)
warning: provided uncertainty may not be accurate. Try increasing sampling size (N0, default 10).
0.6969666189351794 2.2946613187290403e-05
[8]:
period,period_err = star.get_period(p_min=0.1,p_max=1,debug=True) # debug option enables the progress printing
print(period,period_err)
0.000s --- starting the process...
0.000s --- preparing data...
0.000s --- getting a periodogram...
0.509s --- detecting top 5 peaks...
0.510s --- preparing for finer sampling near peaks...
0.511s --- performing finer sampling near peaks...
0.916s --- period candidate:  0.6968767193610299
0.930s --- detecting aliasing...
0.930s --- alias factor:  1
0.931s --- period candidate:  0.6968767193610299
0.932s --- estimating the uncertainty...
0.947s --- period candidate:  0.6968767193610299
0.947s --- period fitted*:  0.6968786839335414
0.947s --- period error:  2.2667570909410562e-05
0.947s --- refining samples...
0.948s --- refining search width = 6.588e-04
1.315s --- period candidate:  0.6968899220719549
1.316s --- period fitted*:  0.6968946264691298
1.316s --- period error:  2.285551532900411e-05
1.316s --- * validating period error...
1.316s --- * fitted period - peak period = 4.70e-06
1.316s --- * expected deviation size = 2.29e-05
1.316s --- * period error validated
1.316s --- period = 0.696890 +- 0.000023d
1.316s --- process completed.
0.6968899220719549 2.285551532900411e-05
Advanced method
Since get_period() internally calls periodogram() function, any arguments that change the setting for periodogram() can be applied. For example, users can change the model:
[35]:
star.get_period(p_min=0.1,p_max=1.0,method='custom',model='Gaussian')
---------------------------------------------------------------------------
RemoteTraceback                           Traceback (most recent call last)
RemoteTraceback:
"""
Traceback (most recent call last):
  File "/home/sterlingym/anaconda3/envs/base2/lib/python3.7/multiprocessing/pool.py", line 121, in worker
    result = (True, func(*args, **kwds))
  File "/home/sterlingym/anaconda3/envs/base2/lib/python3.7/multiprocessing/pool.py", line 44, in mapstar
    return list(map(*args))
  File "/home/sterlingym/Dropbox/projects/PIPS/PIPS/periodogram/custom/custom.py", line 146, in mp_worker
    return REPRs[repr_mode](MODEL=MODEL,p0_func=P0_FUNC,x=x,y=y,yerr=yerr,period=period,**KWARGS)
KeyError: 'loglik'
"""

The above exception was the direct cause of the following exception:

KeyError                                  Traceback (most recent call last)
<ipython-input-35-de8f89e3b3fc> in <module>
----> 1 star.get_period(p_min=0.1,p_max=1.0,method='custom',model='Gaussian')

~/Dropbox/projects/PIPS/PIPS/class_photdata/__init__.py in get_period(self, repr_mode, return_Z, **kwargs)
    405             return self._get_period(**kwargs)
    406         if repr_mode in ['likelihood','lik','log-likelihood','loglik']:
--> 407             period,period_err,Z = self._get_period_likelihood(repr_mode=repr_mode,**kwargs)
    408             if return_Z:
    409                 return period,period_err,Z

~/Dropbox/projects/PIPS/PIPS/class_photdata/__init__.py in _get_period_likelihood(self, period, period_err, p_min, p_max, N_peak, N_noise, Nsigma_range, return_SDE, repr_mode, **kwargs)
    596             repr_mode='loglik',
    597             raise_warnings=False,
--> 598             **kwargs
    599             )
    600         popt,_ = curve_fit(log_Gaussian,periods,lik,p0=[period,period_err,lik.max()],bounds=[[0,0,-np.inf],[np.inf,np.inf,np.inf]])

~/Dropbox/projects/PIPS/PIPS/periodogram/__init__.py in __call__(self, **kwargs)
     15
     16     def __call__(self,**kwargs):
---> 17         periods,power = self._periodogram(**kwargs)
     18         self.periods = periods
     19         self.power = power

~/Dropbox/projects/PIPS/PIPS/periodogram/__init__.py in _periodogram(self, p_min, p_max, custom_periods, N, method, x, y, yerr, plot, multiprocessing, N0, model, raise_warnings, **kwargs)
     91
     92         # main
---> 93         periods,power = METHODS[method](**kwargs)
     94
     95         if 'repr_mode' in kwargs:

~/Dropbox/projects/PIPS/PIPS/periodogram/custom/custom.py in periodogram_custom(x, y, yerr, p_min, p_max, N, p0_func, multiprocessing, model, custom_periods, repr_mode, **kwargs)
    148     if multiprocessing==True:
    149         pool = Pool()
--> 150         chi2 = pool.map(mp_worker,periods)
    151         pool.close()
    152         pool.join()

~/anaconda3/envs/base2/lib/python3.7/multiprocessing/pool.py in map(self, func, iterable, chunksize)
    266         in a list that is returned.
    267         '''
--> 268         return self._map_async(func, iterable, mapstar, chunksize).get()
    269
    270     def starmap(self, func, iterable, chunksize=None):

~/anaconda3/envs/base2/lib/python3.7/multiprocessing/pool.py in get(self, timeout)
    655             return self._value
    656         else:
--> 657             raise self._value
    658
    659     def _set(self, i, obj):

KeyError: 'loglik'
Similarly, any custom model can be implemented:
[7]:
star.get_period(p_min=0.1, p_max=1.0,
                method='custom',
                model=polynomial,
                p0_func=poly_p0,
                arg1 = 1,
                arg2 = 4,
                multiprocessing=False)
warning: provided uncertainty may not be accurate. Try increasing sampling size (N_peak_test, default 500) and/or turn on the force_refine option.
[7]:
(0.6969893983974487, 1.8461033093986469e-09)
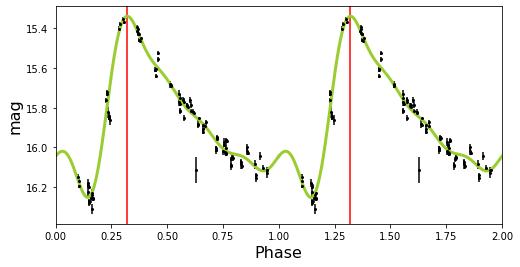
Visualization
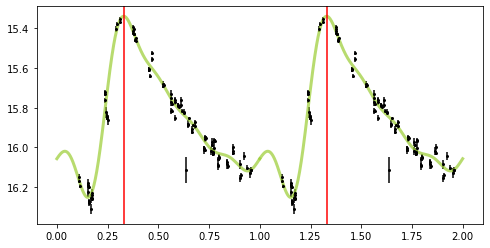
PIPS provides a tool for easy plotting with plot_lc(). This function automatically uses the most recently updated period value in photdata and returns phase-folded data. There is also an easy way to overplot the best-fit model at the period using get_bestfit_curve() function. Like many other functions in photdata, users can specify the model and other parameters.
In addition, get_epoch_offset() returns the time of maxima offset in phase-folded data (in units of original x-axis: not normalized to unitless phase) and enables easy offsetting / visualization of epoch.
[19]:
# detect period
star.get_period()

# phase-folded plot
star.plot_lc() # plots (x%period, y) scatter: normalized to phase
x_th,y_th = star.get_bestfit_curve()
epoch_offset = star.get_epoch_offset() # the epoch offset in the unit of [days] (not normalized to phase)

# plot
plt.plot(x_th/star.period,y_th,c='yellowgreen',lw=3,alpha=0.7)
plt.plot(x_th/star.period+1,y_th,c='yellowgreen',lw=3,alpha=0.7)
plt.axvline(epoch_offset/star.period,color='red')
plt.axvline(epoch_offset/star.period+1,color='red')
[19]:
<matplotlib.lines.Line2D at 0x7f52e36b1dd0>
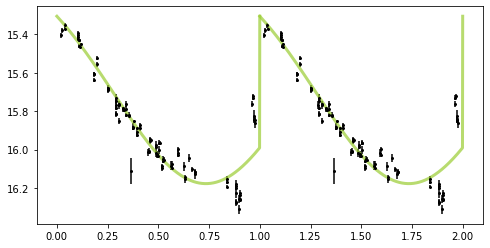
[18]:
# get period with Gaussian model
p_Gaussian,p_err_Gaussian = star.get_period(p_min=0.1,p_max=1.0,method='custom',model='Gaussian')

# auto plot at specified period
star.plot_lc(period=p_Gaussian)
x_th,y_th = star.get_bestfit_curve(period=p_Gaussian,model='Gaussian',Nterms=1,p=1,maxfev=1000000)

# plot
plt.plot(x_th/star.period,y_th,c='yellowgreen',lw=3,alpha=0.7)
plt.plot(x_th/star.period+1,y_th,c='yellowgreen',lw=3,alpha=0.7)
[18]:
[<matplotlib.lines.Line2D at 0x7f52e33e5f50>]
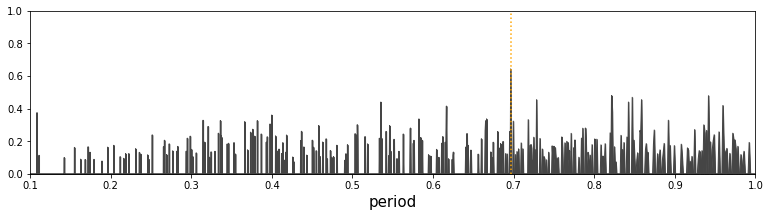
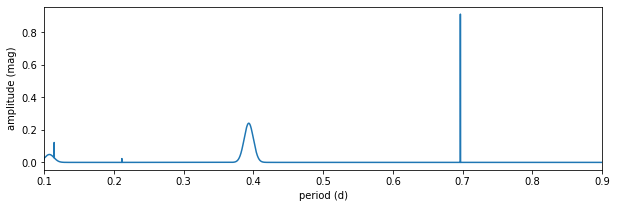
Multi-period detection
When the object is expected to have more than one period (e.g., double-mode pulsator or variable binaries), the light curve can be a superposition of periodic variation at two or more periods. PIPS can automatically generate the amplitude spectrum of multi-periodic objects.
When get_period_multi is called, it returns the detected period and amplitude of top N periods. amplitude_spectrum internally calls it and generates the amplitude spectrum. It should be noted that, however, PIPS forces the detection, even if the signal is just one of the tallest spikes in the background noise and not the real period.
[8]:
# multi-period detection
period,spectrum = star.amplitude_spectrum(p_min=0.1,p_max=0.9,N=10,multiprocessing=False)

plt.figure(figsize=(10,3))
plt.plot(period,spectrum)
plt.xlim(0.1,0.9)
plt.xlabel('period (d)')
plt.ylabel('amplitude (mag)')
plt.show()
warning: provided uncertainty may not be accurate. Try increasing sampling size (N_peak_test, default 500) and/or turn on the force_refine option.
warning: error size infinity: replacing with periodogram peak width
warning: provided uncertainty may not be accurate. Try increasing sampling size (N_peak_test, default 500) and/or turn on the force_refine option.
warning: error size infinity: replacing with periodogram peak width
warning: provided uncertainty may not be accurate. Try increasing sampling size (N_peak_test, default 500) and/or turn on the force_refine option.
warning: error size infinity: replacing with periodogram peak width
warning: provided uncertainty may not be accurate. Try increasing sampling size (N_peak_test, default 500) and/or turn on the force_refine option.
warning: error size infinity: replacing with periodogram peak width
warning: provided uncertainty may not be accurate. Try increasing sampling size (N_peak_test, default 500) and/or turn on the force_refine option.
warning: error size infinity: replacing with periodogram peak width
[ ]: